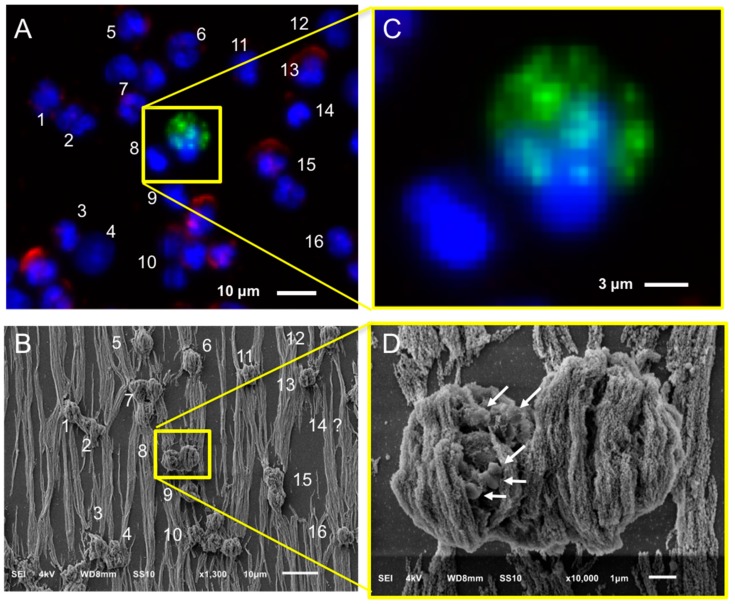
Figure 3.
Relocation of an identified CTC of a CRPC patient by fluorescence (CellTracks Analyzer II) imaging (Panels A and C) after immunomagnetic enrichment using the CellSearch system and SEM imaging (Panels B and D). Magnified fluorescence and SEM images of the enclosed by the yellow square CD45−, CK− nucleated cell (left), and CD45−, CK+ apoptotic CTC (right) are shown at Panels B and D, respectively. Nucleus (DNA) is represented by blue, CK by green, and CD45 by red. The arrows of Panel D are pointing at vesicles on the surface of a cell of unknown lineage (DNA+, CK−, CD45−).

