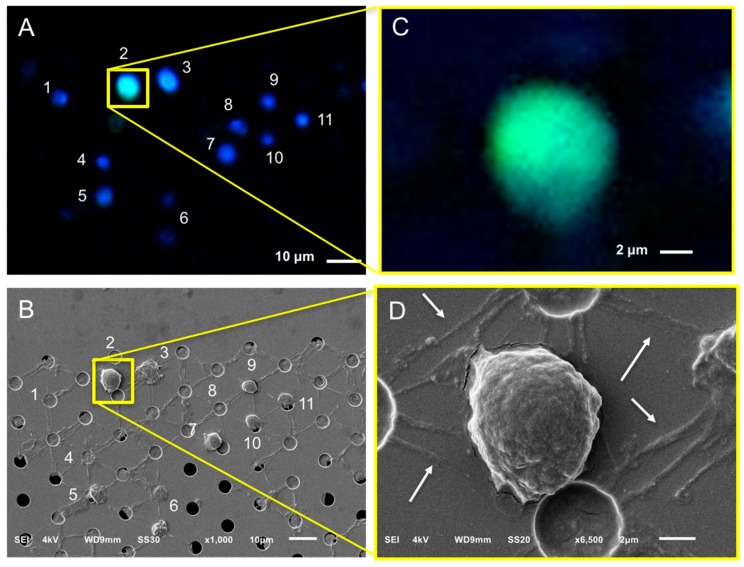
Figure 7.
Relocation of an identified CTC in a blood sample of a castration-resistant prostate cancer patient after microsieve filtration and fluorescence imaging (Panels A,C). Pores were relocated and the respective cells were SEM imaged (Panels B,D). Nucleus (DNA) is represented by blue and CK by green. Fluorescence and SEM images of the enclosed by the yellow square DNA+, CK+, CD45− CTC at Panels A,B are shown with higher magnification at Panels C,D, respectively. Arrows (Panel D) are pointing at the membrane or/and nucleus stripes of cells connecting the neighboring pores.

