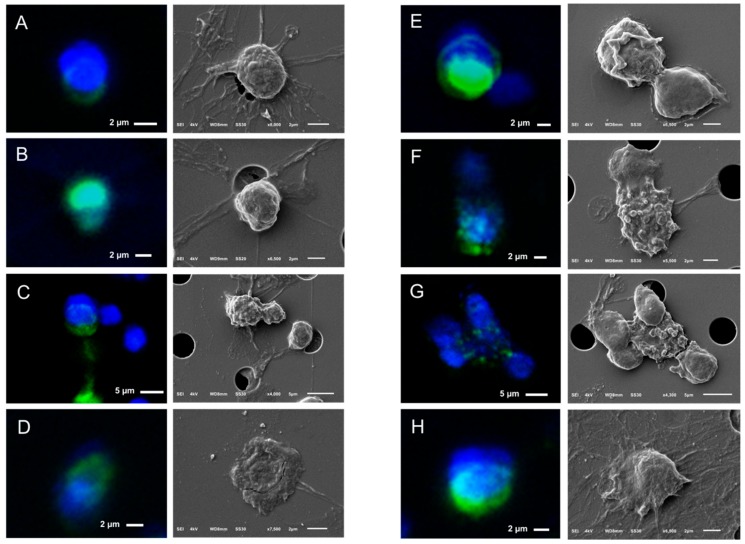
Figure 8.
Gallery of correlated fluorescence and SEM images of CTCs of a CRPC patient isolated by whole blood filtration using 5 μm microsieves. Nucleus (DNA) is represented by blue and CK by green. Membrane (Panel C) or nucleus (Panel B) stripes connecting the neighboring pores indicate cell damage and were found throughout the whole microsieve. CTCs ended up on (Panels A–C,F,H), within (Panel D), or in between the pores (Panels E,G,H).

