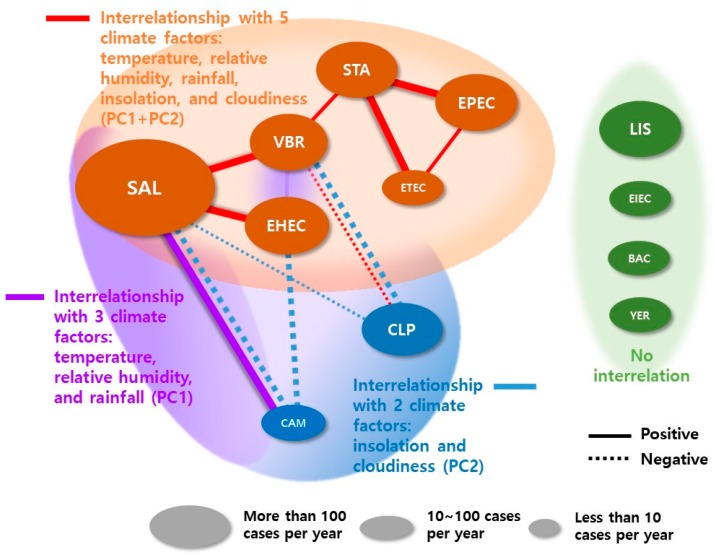
Figure 2.
Microbial interrelationship network inferred from the monthly incidence of 12 bacterial FBDs according to climatic variables. Nodes represent the incidence of a bacterial FBD; the size indicates the number of cases per year. Lines represent significant pairwise associations between pathogens; thick and thin lines: p < 0.01 and <0.05, respectively. Red, purple, and blue lines show the interrelationship under the 3 conditional climatic variables: PC1 + PC2, PC1, and PC2, respectively. BAC: B. cereus; CAM: campylobacteriosis; CLP: C. perfringens; LIS: Listeria spp.; SAL: salmonellosis; EPEC, ETEC, EIEC, EHEC: pathogenic infection by enteropathogenic, enterotoxigenic, enteroinvasive, enterohemorrhagic E. coli, respectively; STA: S. aureus; VBR: V. parahaemolyticus; YER: Y. enterocolitica infection.

