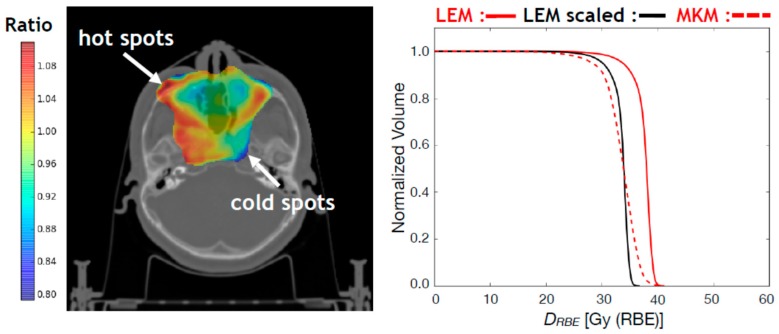
Figure 6.
Left panel: ratio between FRoG-calculated MKM DRBE and LEM DRBE multiplied by the clinical scaling value (see the next for more details) for the 12C ion patient shown in Figure 4. Only the values for the CTV are displayed. Right panel: FRoG-calculated LEM and MKM DRBEVH for the CTV are displayed with a red solid line and red dashed line, respectively. The DRBEVH for the LEM DRBE values rescaled by the clinical scaling factor is displayed with a black solid line.

