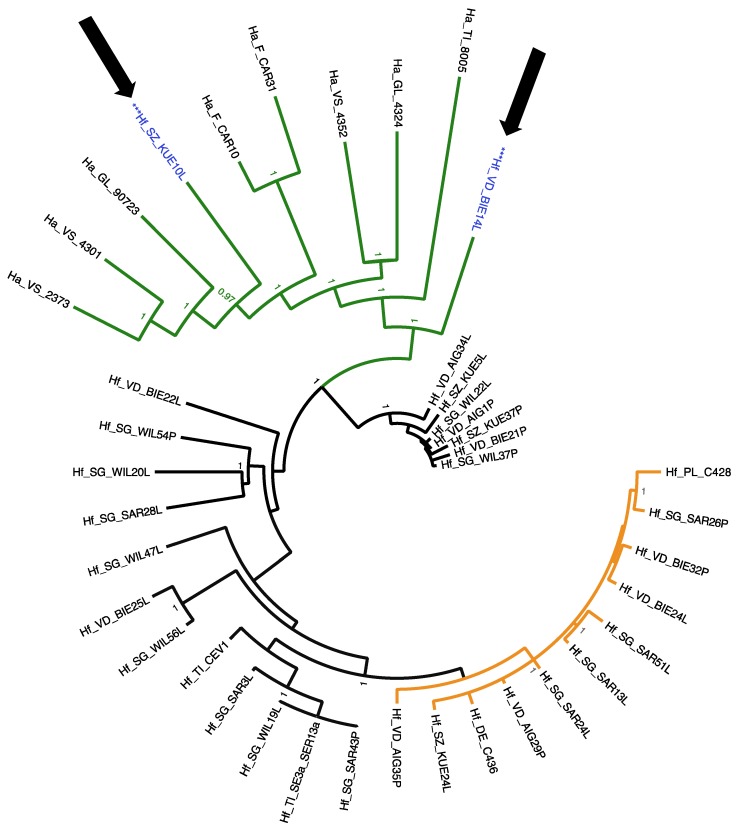
Figure 2.
Phylogenetic tree resulting from the MrBayes analysis conducted with 40 (8 H. albidus, 32 H. fraxineus) full sequences (2151 bp) of the RdRP gene of the mitovirus HfMV1. Green color depicts HfMV1 H. albidus group isolates. Black color depicts HfMV1 group 2 isolates and orange color HfMV1 group 1 isolates. Blue color and *** marks H. fraxineus isolates within the H. albidus group. Hf characterizes viral sequences from H. fraxineus, Ha from H. albidus isolates. For abbreviation see Table 1. Posterior probabilities are shown at the respective branch if they were >0.95. Arrows indicate intermixing of H. albidus and H. fraxineus HfMV1 sequences.

