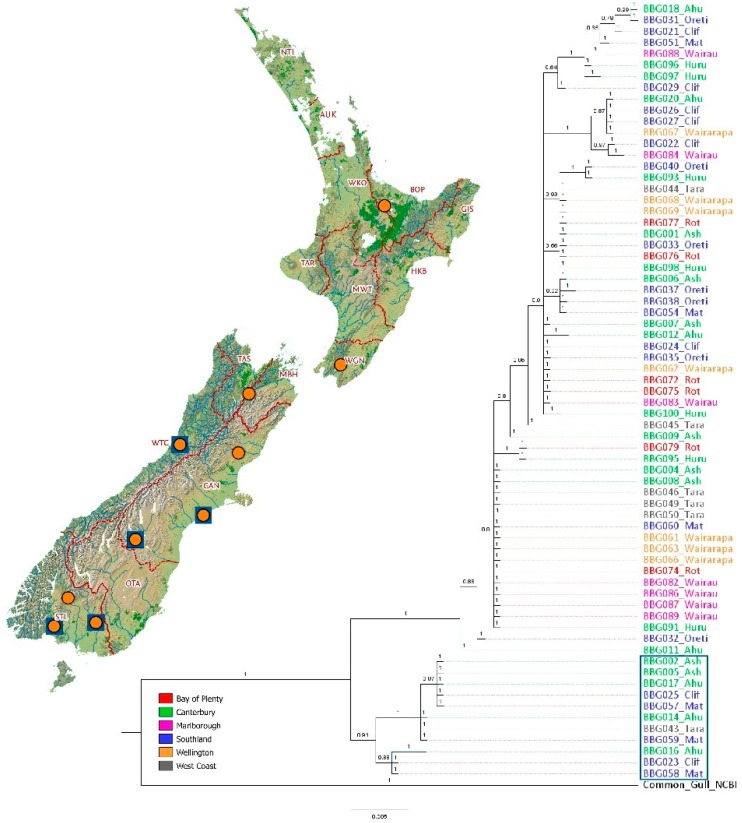
Figure 1.
Bayesian tree of black-billed gulls using mtDNA (mitochondrial DNA) control region, first domain. Posterior probabilities are shown above the branches. Scale depicts the distance corresponding to 0.005 nucleotide substitutions per site. Orange circles show locations of colonies from which chick blood samples were analysed (10 colonies, 100 samples; 94 for Single Nucleotide Polymorphisms (SNPs), 69 for mtDNA control region). Blue rectangle on the tree contains locations corresponding to the blue squares on the inset map highlighting the locations of colonies found within the smaller clade (matching published red-billed gull data). Colour legend indicated regions. Regions are outlined: AUCK—Auckland, BOP—Bay of Plenty, CAN—Canterbury, GIS—Gisborne, HKB—Hawke’s Bay, MGH—Marlborough, MWT—Manawatu—Wanganui, NTL—Northland, OTA—Otago, STL—Southland, TAR—Taranaki, TAS—Tasman, WGN—Wellington, WKO—Waikato, WTC—West Coast.

