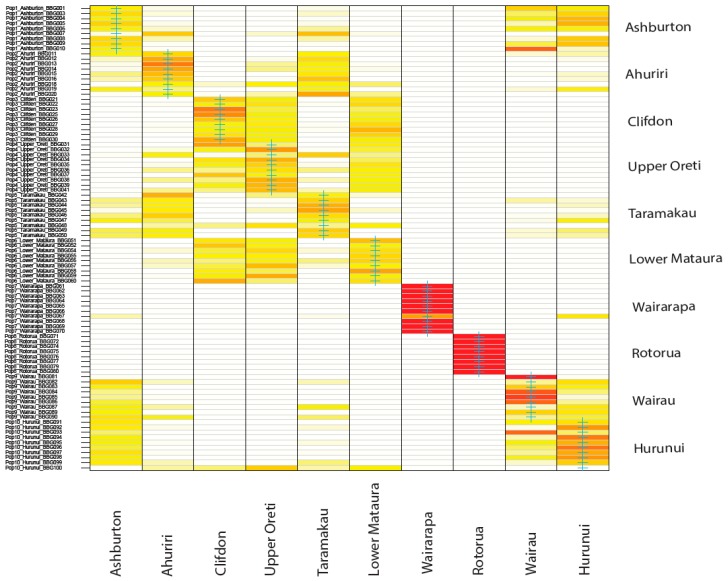
Figure 4.
Discriminant analysis of principal components assignment plot showing the cluster membership probability for each of the black-billed gulls to each of the 10 sampled populations. Red indicates high assignment probability, white indicates low assignment probability, and yellow across multiple populations indicates assignment is mixed or uncertain.

