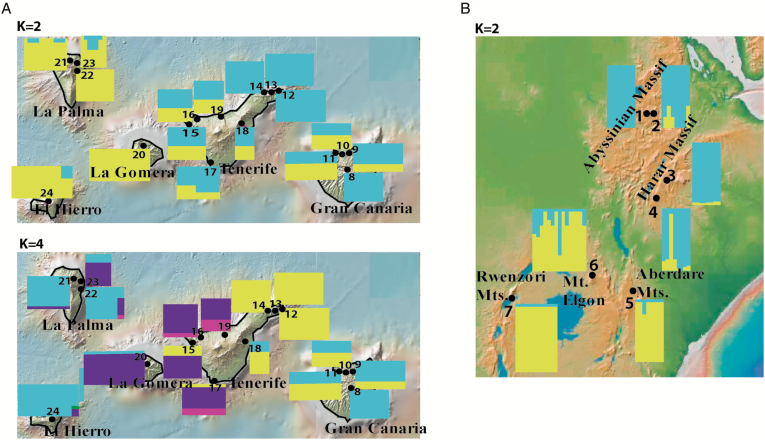
Fig. 2.
Results of the genetic structure analyses for (A) C. canariensis and (B) C. eminii. Histograms show the Bayesian clustering of individuals within populations (STRUCTURE). Colours represent the individual proportion for each of the inferred Bayesian groups. All other conventions as in Fig. 1.

