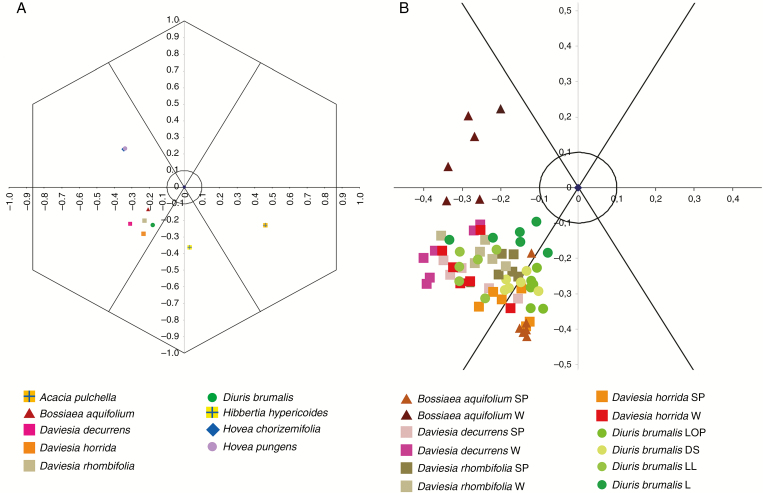
Fig. 6.
(A) Mean values of colour loci calculated for floral parts of Daviesia decurrens, Da. horrida, Da. rhombifolia, Hovea chorizemifolia, H. pungens and Bossiaea aquifolium. In addition, colour loci are presented for two commonly occurring yellow-flowered species present at all sites, Hibbertia hypericoides (Dilleniaceae) and Acacia pulchella (Fabaceae), to test model similarity based on floral colour. (B) Distribution of colour loci most similar to the Di. brumalis colour signal. Measurements of spectral reflectance were taken for Di. brumalis: LOP = lateral outer petal; DS = dorsal sepal; LL = labellum lateral lobe; L = labellum; for pea plant species (Faboideae): SP = standard petal; W = wing petals. The calculations were made using the Hexagon colour model of bee vision (Chittka, 1992).

