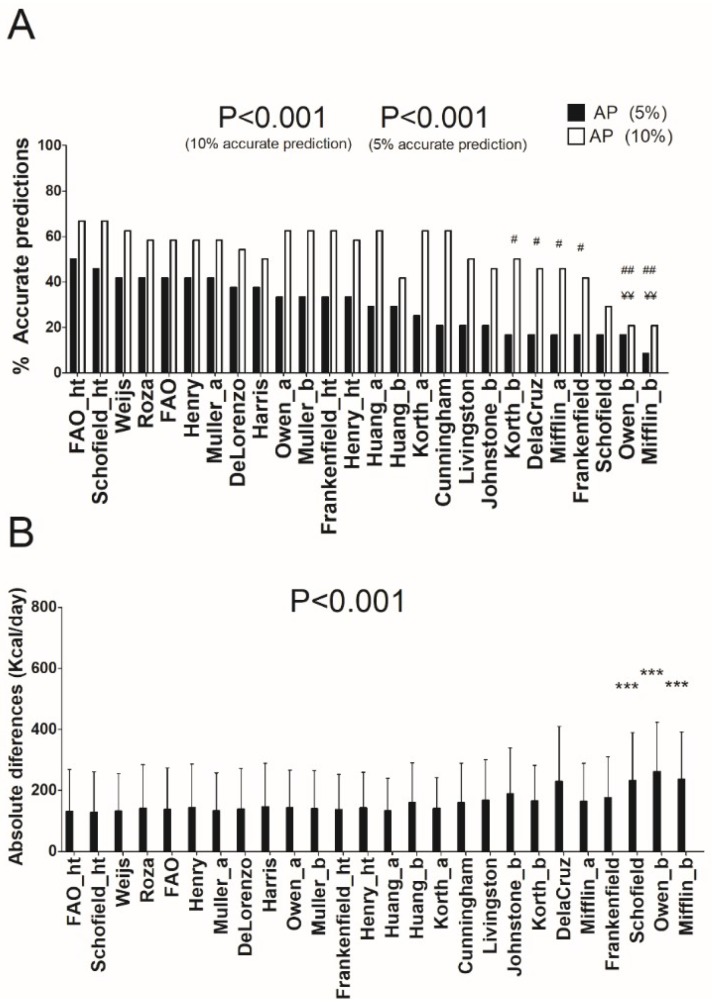
Figure 1.
Percentage of accurate prediction of resting energy predictive equations and mean differences between predicted and measured resting energy expenditure in absolute values in normal-weight individuals. (A) Percentage of prediction accuracy at 5% and 10% of resting energy expenditure. (B) Mean (SD) differences between predicted and measured resting energy expenditure in absolute values; p value of repeated measures analysis of variance (with Bonferroni post-hoc analysis) among the predictive equations; * = p < 0.05; ** = p < 0.01; *** = p < 0.001 when compared with the predictive equation that presented the least absolute differences with respect to the measured resting energy expenditure (FAO_ht); ¥ = p < 0.05; ¥¥ = p < 0.01; ¥¥¥ = p < 0.001 when compared with the predictive equation that presented the best resting energy expenditure prediction accuracy (10%) with respect to the measured resting energy expenditure (FAO_ht); # = p < 0.05; ## = p < 0.01; ### = p < 0.001 when compared with the predictive equation that presented the best resting energy expenditure prediction accuracy (5%) with respect to the measured resting energy expenditure (FAO_ht). AP: Accurate prediction; “_a” refers to predictive equations which require only anthropometric parameters to calculate REE, “_b” refers to predictive equations which require body composition parameters to calculate REE, and “_ht” refers to predictive equations which are proposed by the same author and include height.

