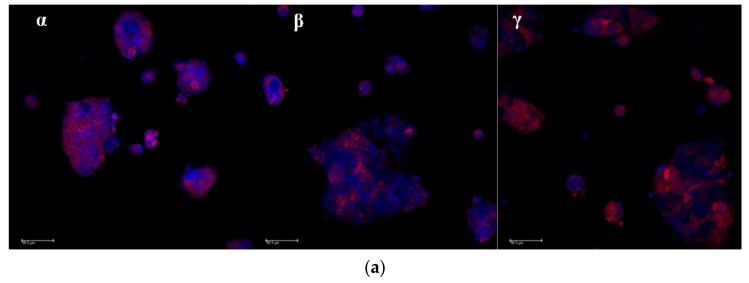
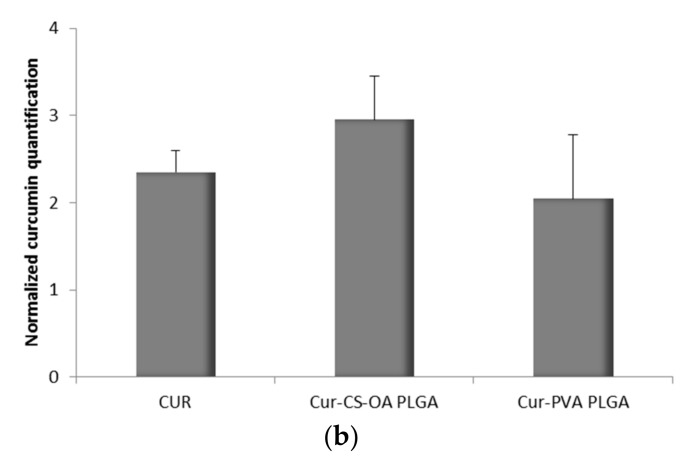
Figure 8.
(a) Representative CLSM photomicrographs of Caco-2 cell substrates grown after 48 h on microscope slides and treated 24 h with the samples. (α) Free curcumin; (β) Cur-CS-OA PLGA; (γ) Cur-PVA-PLGA. Bar: 50 µm; (b) CLSM fluorescence quantification, obtained by image analysis, of the amount of curcumin associated to the cells grown on microscope slides (mean ± SD; n = 3).


