Figure 1.
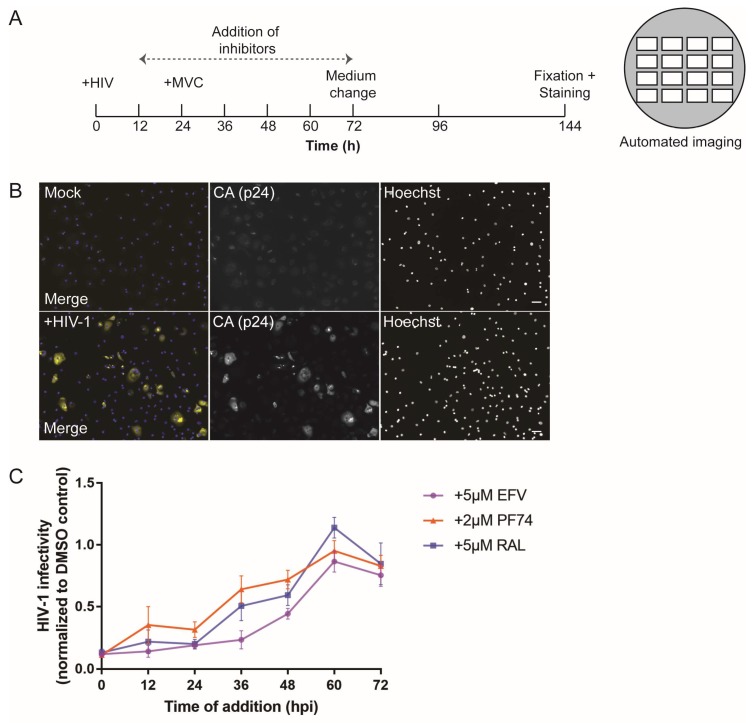
Time course analysis of human immunodeficiency virus type 1 (HIV-1) early post-entry events in primary macrophages. (A) Scheme of inhibitor time-of-addition experiments. (B,C) Monocyte-derived macrophages (MDMs) from six donors in three independent experiments were infected with R5-pseudotyped HIV-1NL4-3. At 24 h post infection (p.i.), medium was changed and 5 µM maraviroc (MVC) was added to prevent further entry events. At day 6 p.i., samples were fixed and stained. (B) Productive infection was assessed by immunostaining with anti-p24 capsid (CA) antiserum (yellow) and counterstaining with Hoechst (blue). Samples were imaged in an automated screening microscope. Scale bars represent 50 µm. (C) Solutions of 5 µM efavirenz (EFV; purple line), 5 µM raltegravir (RAL; blue line), or 2 µM PF74 (orange line) were added at the indicated time points to different samples. At 72 h p.i., medium was replaced in all samples by fresh medium containing the respective inhibitors and infection was again scored at day 6 p.i. The mean proportion of infected cells from triplicate samples of all donors in treated samples normalized to the respective dimethyl sulfoxide (DMSO) control is shown. Error bars represent standard error of the mean (SEM). Refer to Figure S1 (Supplementary Materials) to see the results for individual donors.

