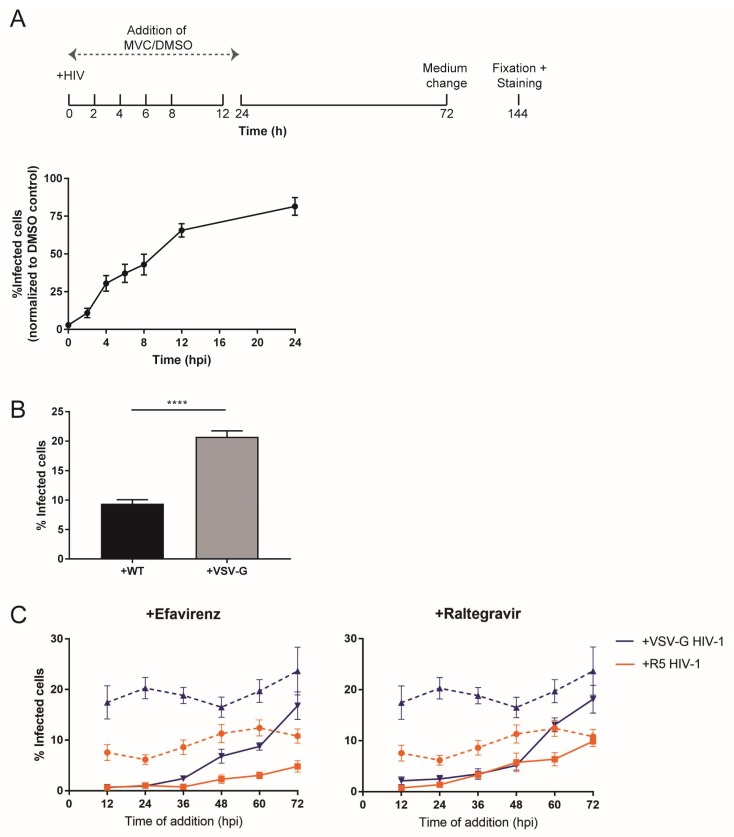
Figure 4.
Effect of time and type of cell entry on HIV-1 replication kinetics. (A) MDMs from four donors were infected with R5-pseudotyped HIV-1NL4-3. Subsequently, 5 µM MVC or an equivalent volume of DMSO was added to the medium at the indicated time points p.i. Medium was replaced, and infection was continued in the presence of the inhibitor until day 6. Cells were fixed, and productive infection was scored by CA immunostaining. Proportions of infected cells were normalized to the highest proportion observed in the DMSO control. The graph shows mean values and SEM from triplicates or quadruplicates of all donors after normalization. (B,C) Influence of entry route: (B) MDMs from four donors were infected with R5- or vesicular stomatitis virus (VSV-G) pseudotyped HIV-1NL4-3. At 24 h p.i., medium was changed, and infection continued until day 6 p.i. Cells were fixed, and infectivity was scored as above. The graph shows mean values and SEM from the four samples. Statistical significance was assessed with a non-paired two-tailed Mann–Whitney test; **** p < 0.0001. (C) MDMs from the same donors as in (B) were infected with equal amounts of R5-pseudotyped (orange lines) or VSV-G pseudotyped (blue lines) HIV-1NL4-3. After 24 h, medium was changed. Solutions of 5 µM EFV (left plot, solid lines) or 5 µM RAL (right plot, solid lines), or DMSO (dashed lines) were added every 12 h until 72 h p.i. At this time point, medium was changed, and infection continued until day 6 in the presence of the inhibitors. Infectivity was scored as before. Mean values from infectivity values of the replicates of all donors and SEM are shown.

