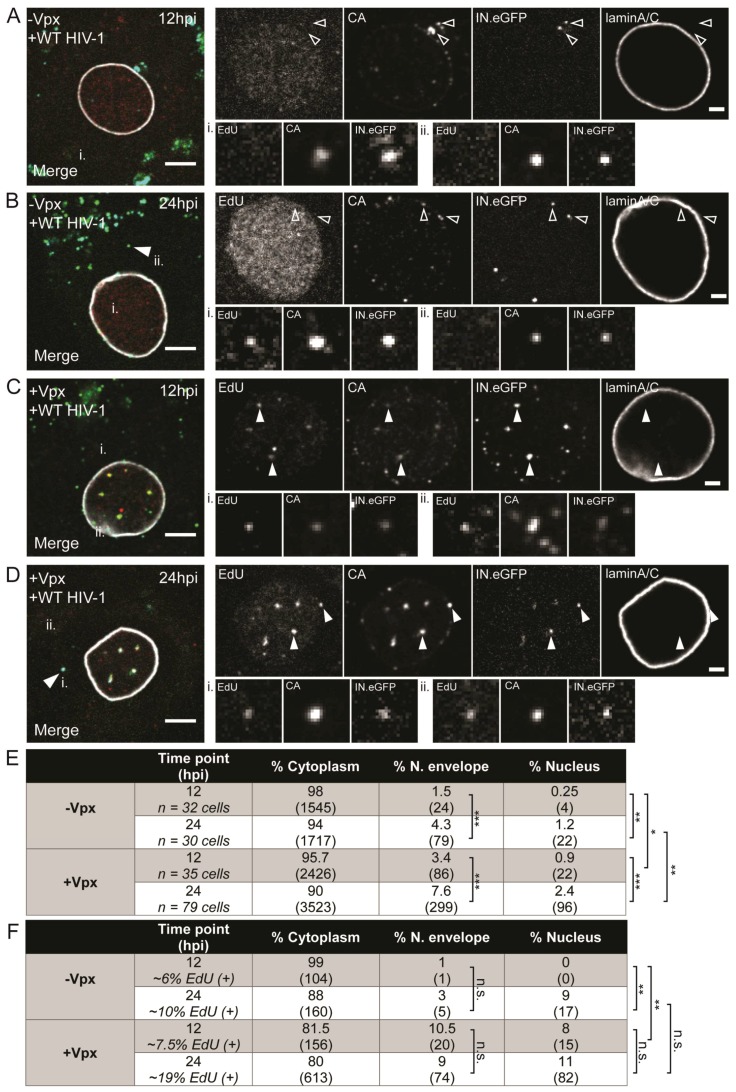
Figure 7.
Detection of nascent viral complementary DNA (cDNA) by EdU click-labeling following SAMHD1 degradation. MDMs from three donors were transduced with 150 mU of RT of VLPs lacking (A,B) or carrying Vpxmac239 (C,D). After 12 h, cells were infected with R5-pseudotyped HIV-1NL4-3 (IN.eGFP) in the presence of 10 µM EdU. Cells were fixed at 12 (A,C) or 24 h p.i. (B,D) and click-labeled as described in Section 2.5. CA (cyan) and laminA/C (white; labeling the nuclear envelope) were detected by immunostaining; EdU and IN.eGFP signals in the overlays are represented in red and green, respectively. Enlargements of the nuclear region are displayed in the top right panels. Examples of individual RTC/PIC (i,ii) indicated in the merged panels are enlarged in the lower right. Note that focal planes may differ between overview of the nuclear region and particle enlargement. Exemplary complexes of different types are indicated by arrowheads: solid arrows indicate co-localizing EdU and IN.eGFP signals; empty arrows identify HIV-1 complexes lacking EdU signals. Scale bars represent 5 µm (overview) or 2 µm (enlargements). (E) Proportion of IN.eGFP-positive objects in n cells in three subcellular localizations at the indicated time points in cells treated with plasmid cDNA or Vpx VLPs. Numbers of detected objects are given in parentheses. Proportions were compared using a two-tailed Z-test (α = 0.05); *** p < 0.0001; ** p < 0.002; * p = 0.01; n.s.: not significant. (F) Proportion of IN.eGFP- and EdU-positive objects from (E) in n cells in three subcellular localizations at different time points in the presence or absence of Vpxmac239. Numbers of detected objects are given in parentheses. Proportions were compared using a two-tailed Z-test (α = 0.05); *** p < 0.0001; ** p < 0.005; * p = 0.01; n.s.: not significant.

