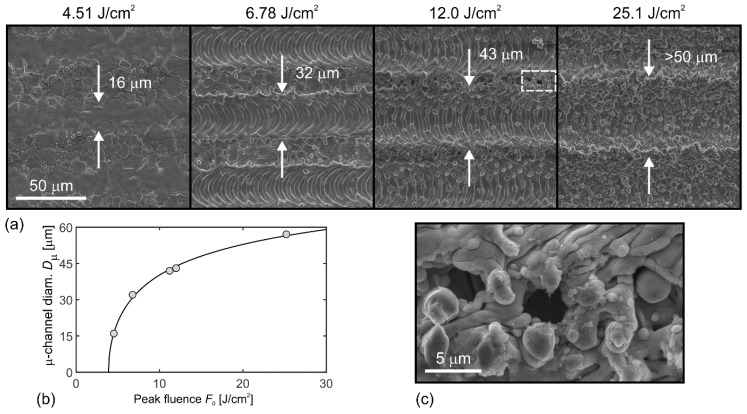
Figure 1.
(a) SEM micrographs of μ-channels at different peak fluences F0 (shown on the top of each micrograph); scan line separation in all cases equaled Δx = 50 μm. (b) Experimental (points) and theoretical (line; see Equation (2)) dependence of μ-channels diameter on peak fluence F0. (c) Magnification of the selected area in (a) showing the appearance of μ-cavities.

