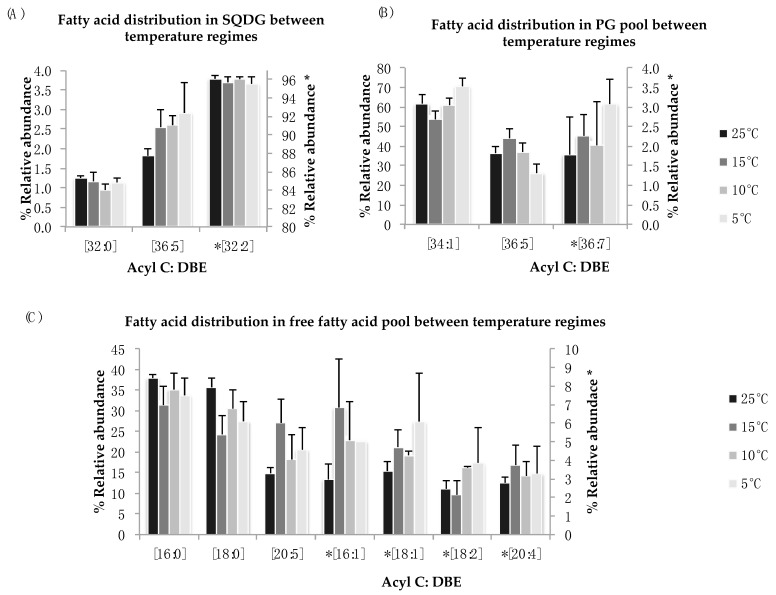
Figure 5.
(A–C): Lipid acyl distributions for SQDG, PG, and FFA. Fatty acid distribution of SQDG, PG, and FFA lipid species across temperature on the basis of acyl carbon and unsaturation: Relative abundance of lipid specie was calculated by averaging S/N values obtained by positive ionization mode from biological triplicates (n = 3); ±SEM are shown (p ≤ 0.05). * Indicate secondary y-axis to show relative abundances.

