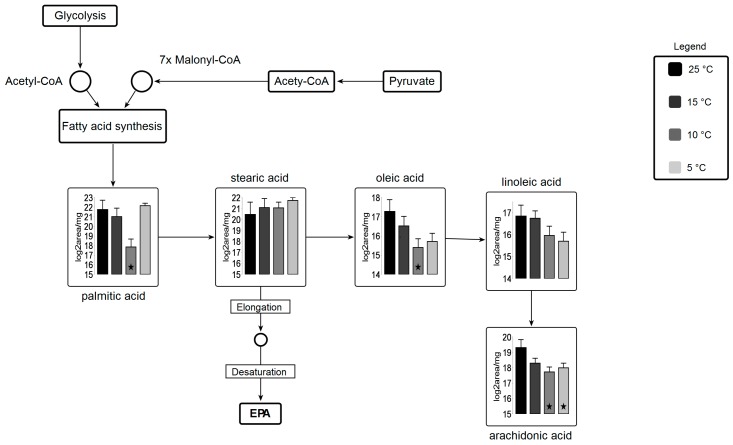
Figure 7.
Metabolic pathway for fatty acid biosynthesis coupled with carbohydrate metabolism Circles represent undetected metabolites, averaged log2 transformed of biological triplicates (n = 9) is shown in the graphs, VANTED software used to perform t-test to detect significant changes in metabolomics data. ★ represents statistically significant difference as compared to 25 °C (p ≤ 0.05).

