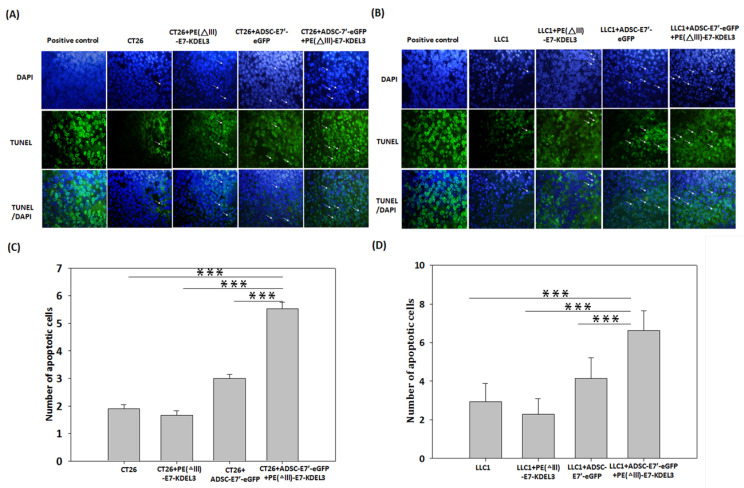
Figure 4.
Evaluation of apoptosis in tumor tissues by TUNEL staining. Representative fluorescence images of (A) the CT26 tumor with different treatments; or (B) the LLC1 tumor with different treatments. Apoptotic-positive cells were shown in green (arrows) and the cellular nucleus was stained by DAPI and shown in blue. (C,D) The number of apoptotic-positive cells in the microscopic fields were calculated. The quantitative results are presented as means + standard error of means (SEM); *** indicates p < 0.001 using unpaired t-test with Welch’s correction. Magnification A,B: 50 µm.

