Figure 2.
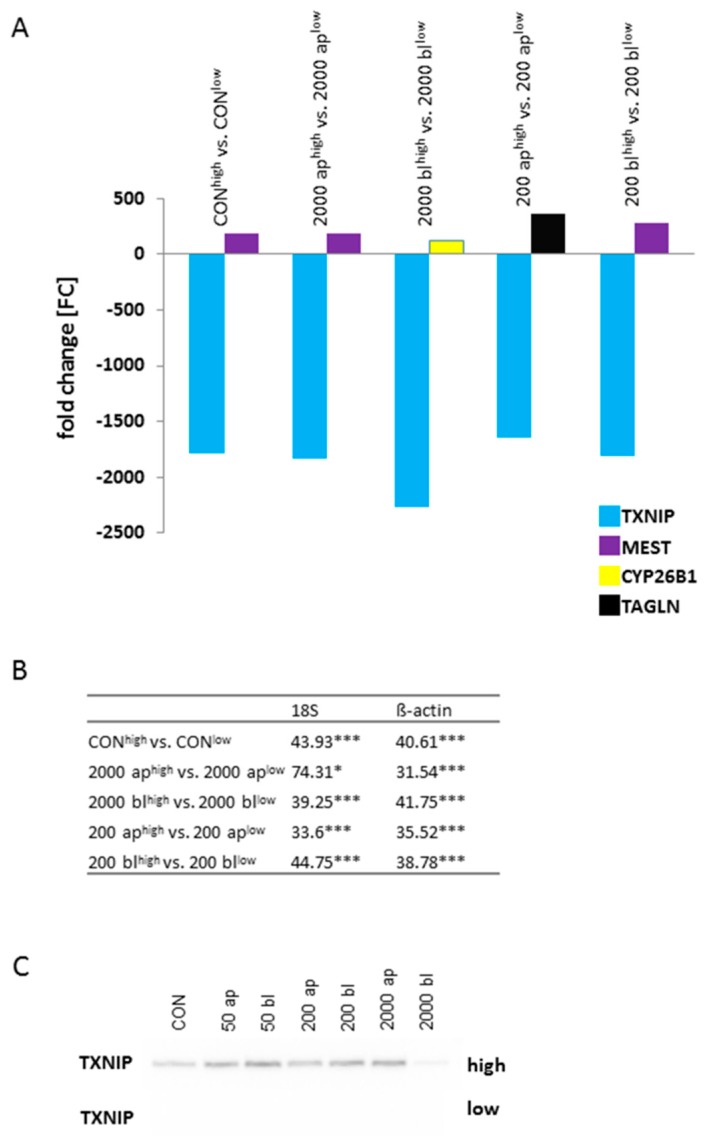
Constitutively regulated genes of the microarray analyses. (A) 2610 genes were basically up- or down-regulated in the pairwise comparison of DON-treatment groups dependent on glucose concentration in the microarray analyses. The highest up- and down-regulated genes in the pairwise comparisons within the pool of basically regulated genes are shown: TXNIP (thioredoxin interacting protein), MEST (mesoderm specific transcript), CYP26B1 (cytochrome P450 family 26 subfamily B member 1), and TAGLN (transgelin). (B) qPCR data [relative quantification; %] of TXNIP are shown in the table (N = 5). All comparisons resulted in a significant down-regulation in DON-treatment groups under low glucose when compared to the appropriate treatment group under high glucose (p < 0.05 *; p < 0.001 ***). (C) A reduction of TXNIP was found on protein level in all DON-treatment groups under low glucose when compared to the equivalent group of high glucose (N = 3).

