Figure 6.
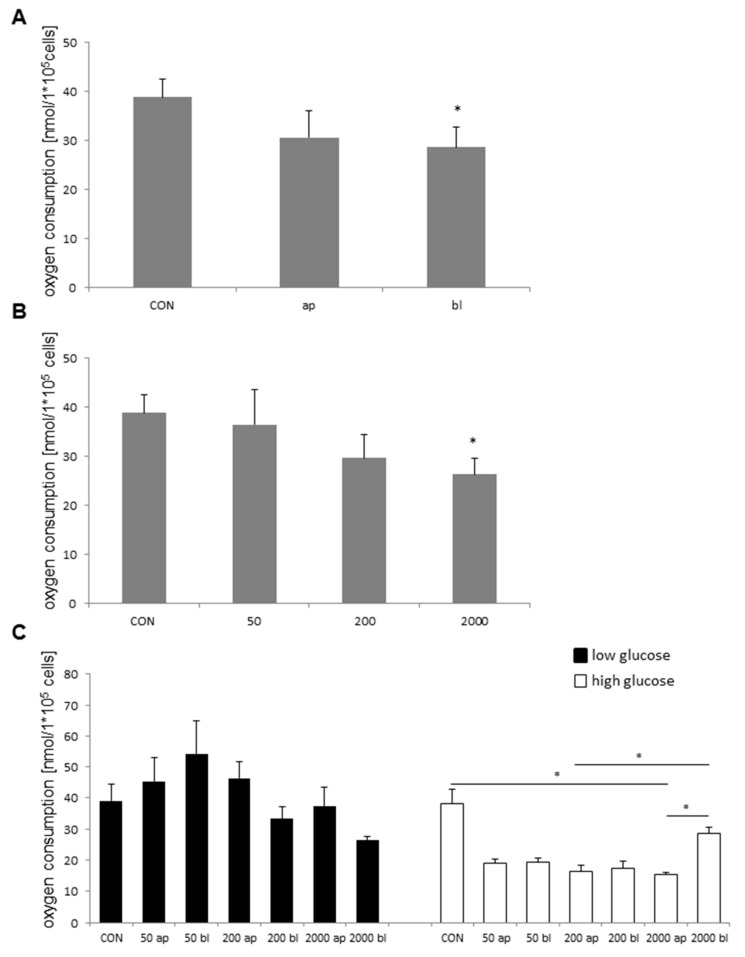
Oxygen consumption (N = 5) dependent on DON-application (A), concentration (B), and glucose concentration (C). (A) Apical and basolateral application independent of glucose concentration and DON-concentration resulted in a slight, but not significant decrease in apical application when compared to the control (Kruskal–Wallis Test; p = 0.01; Mann–Whitney Test; p = 0.003); control: 38.85 nmol/L × 105 cells; apical: 30.60 nmol/L × 105 cells) and showed a significant decrease in basolateral application (28.68 nmol/L × 105 cells). (B) In the next step, the effect of different DON concentrations on oxygen consumption was analyzed. Therefore, all data were summarized and divided into four groups (Kruskal–Wallis Test; p = 0.019; Mann–Whitney Test; p = 0.006; CON: 38.85 nmol/L × 105 cells; 50: 36.44 nmol/L × 105 cells; 200: 29.66 nmol/L × 105 cells; 2000: 26.34 nmol/L × 105 cells). A significant difference was found between CON vs. 2000. (C) Under low glucose supply, no significant differences were detectable (Kruskal–Wallis; p = 0.089): CON 38.85 nmol/L × 105 cells; 50 ap: 45.42 nmol/L × 105; 50 bl: 54.34 nmol/L × 105; 200 ap: 46.30 nmol/L × 105; 200 bl: 33.24 nmol/L × 105; 2000 ap: 37.34 nmol/L × 105; 2000 bl: 26.37 nmol/L × 105 cells. Furthermore, oxygen consumption under different DON concentrations and high glucose supply was analyzed (Welch ANOVA; p = 0.004). A trend of lower oxygen consumption was detected under 50 ap (19.16 nmol/L × 105 cells; p = 0.089), 50 bl (19.23 nmol/L × 105; p = 0.088), 200 ap (16.4 nmol/L × 105 cells; p = 0.051), and 200 bl (17.46 nmol/L × 105 cells; p = 0.062). A significant difference was found between CON vs. 2000 ap (15.22 nmol/L × 105 cells; p = 0.047), 200 ap vs. 2000 bl (28.47 nmol/L × 105 cells; p = 0.035), and 2000 ap vs 2000 bl (p = 0.016). (p < 0.05 *)

