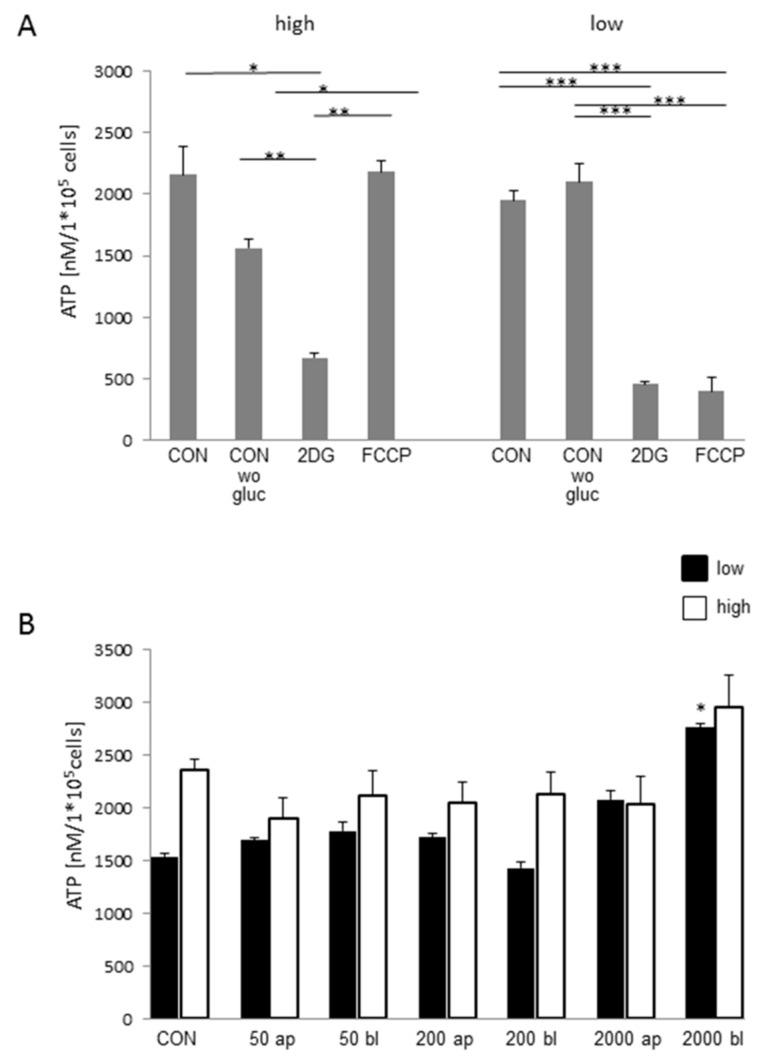
Figure 8.
ATP-content (N = 3). (A) ATP values for high glucose conditions were analyzed by Welch ANOVA (p < 0.001; Games Howell. A significantly lower ATP concentration was found in the treatment group of 2DG when compared to the control (p = 0.036). 2DG (p = 0.0002) and FCCP (p = 0.012) were significantly different from CON wo gluc. Additionally, FCCP (p = 0.002) showed a significantly higher ATP content than 2DG. Under low glucose supply (ANOVA F (3,8) = 61.463; p < 0.001), 2DG and FCCP showed a significantly lower ATP content when compared to the control. The same result was observed when compared to CON wo glucose. (B) No differences were observed with the focus on ATP concentration under high glucose conditions (Kruskal–Wallis Test; p = 0.653). Furthermore, 2000 bl showed a significantly higher ATP concentration under low glucose supply when compared to all other treatment groups (ANOVA F (6;14) = 11.768; p < 0.001; Tukey). Additionally, 200 bl was significantly lower when compared to 2000 ap (p = 0.040). In the comparisons of high and low glucose with the appropriate DON-treatment, no differences were detected. (p < 0.05 *; p < 0.01 **; p < 0.005 ***).

