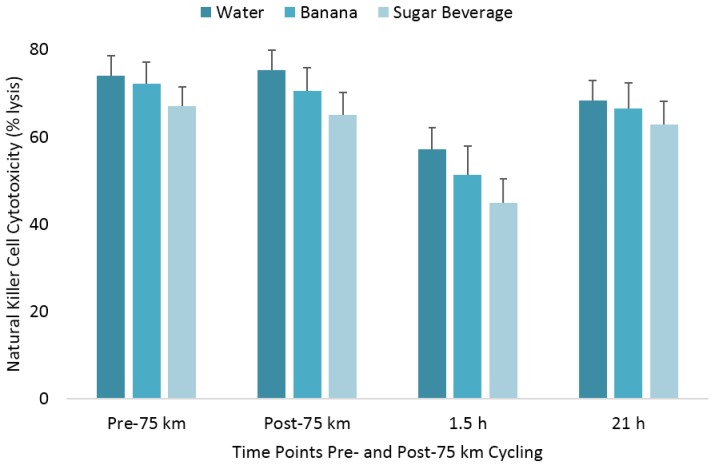
Figure 3.
Change in natural killer cell cytotoxicity following 75 km cycling in n = 20 cyclists (immediately, 1.5 h, and 21 h post-exercise). The changes from pre-exercise in the banana and sugar beverage trials did not differ from the water trial. Vertical lines represent the standard errors. Time effect, p = 0.014; time × trial effect, p < 0.001.

