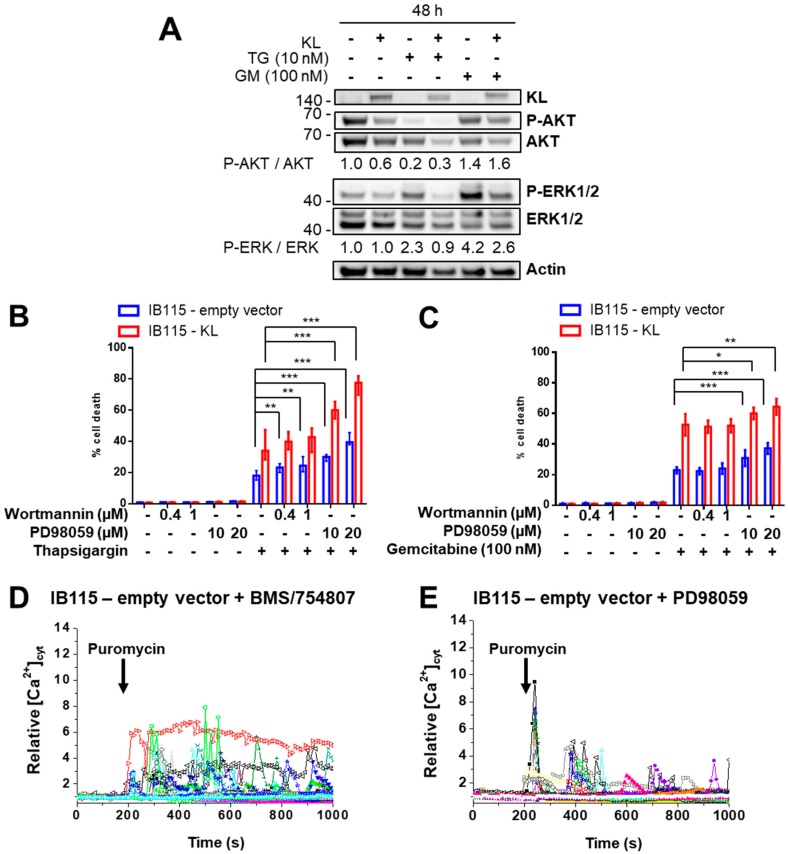
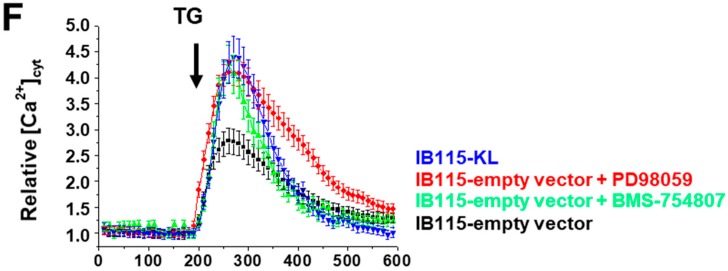
Figure 7.
Klotho regulates drug sensitivity and reticular Ca2+-leakage by inhibiting ERK1/2 signaling (A) Analysis by Western blotting of the abundance of phosphorylated AKT and ERK1/2 compared to total protein expression, in IB115-empty vector and IB115-KL cells after 48 h of incubation with no drugs, 10 nM thapsigargin (TG) or 100 nM gemcitabine. Actin was used as a loading control. To compare the ratios between phosphorylated form and total protein during treatments, results were all normalized to the control condition (IB115-empty vector, no treatment) set to 1. Results are representative of three independent experiments. (B,C) Cell death was measured by TMRM-staining and flow cytometry. IB115 cell lines were pretreated for 2 h with Wortmannin or PD98059 as indicated and then incubated for 72 h with (B) 20 nM or 10 nM TG for IB115-empty vector and IB115-KL cells, respectively (in order to have an almost similar cell death), or (C) 100 nM gemcitabine. Histograms sum up (B) four (with median and IQR) and (C) three (represented as means ± SD) independent experiments. (D–F) Variations of relative cytosolic Ca2+ concentration were monitored by fluorescence videomicroscopy, in Fluo2-loaded cells bathed in a Ca2+-free HBSS medium. (D,E) Puromycin (25 µg/mL) was added at 200 s to IB115-empty vector cells pretreated with (D) BMS-754807 (50 nM, 24 h) or (E) PD98059 (1 µM, 2 h). Each trace corresponds to the evolution of [Ca2+]cyt in one cell. Data shown are representative of three independent experiments. (F) TG (10 nM) was added at 200 s to IB115-KL cells (n = 83) and IB115-empty vector cells, which were not pretreated (n = 77) or pretreated with BMS-754807 (50 nM, 24 h, n = 78) or PD98059 (1 µM, 2 h, n = 75). Results correspond to means ± SD.


