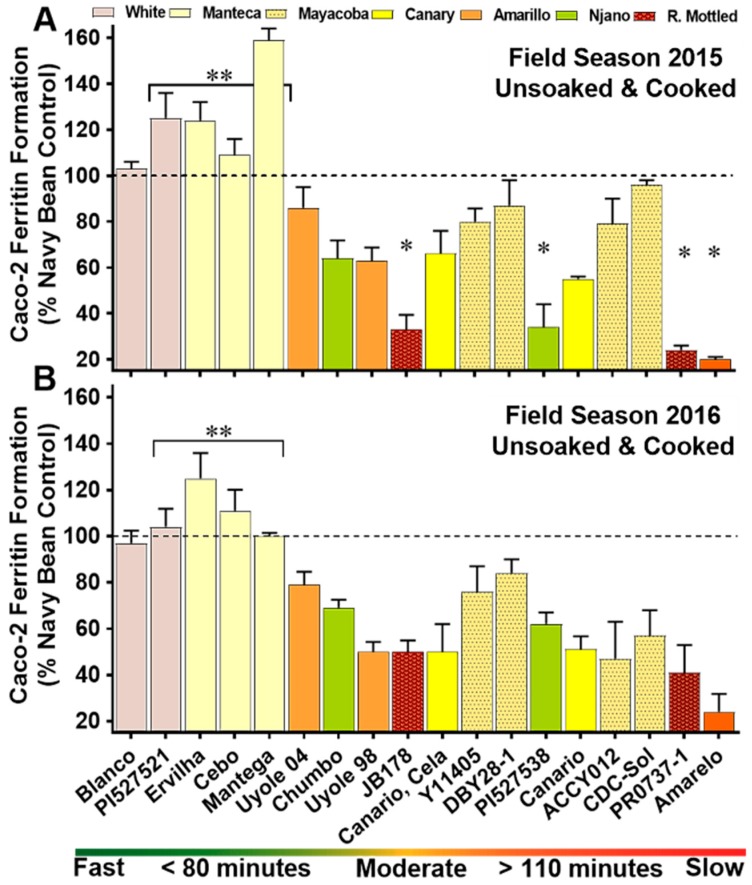
Figure 4.
Iron bioavailability scores of unsoaked and cooked whole seed genotypes in the YBP for field season 2015 (A) and field season 2016 (B). Values are means (±Standard Deviation) of triplicate measurements from two field replicates per genotype (n = 6). Genotypes are categorized on the x-axis by cooking class, ranked from the fastest cooking genotype to slowest cooking entry. * Significantly lower (p ≤ 0.05) iron bioavailability score when compared to the other YBP entries. ** Significantly higher (p ≤ 0.05) iron bioavailability scores compared to the other YBP genotypes.

