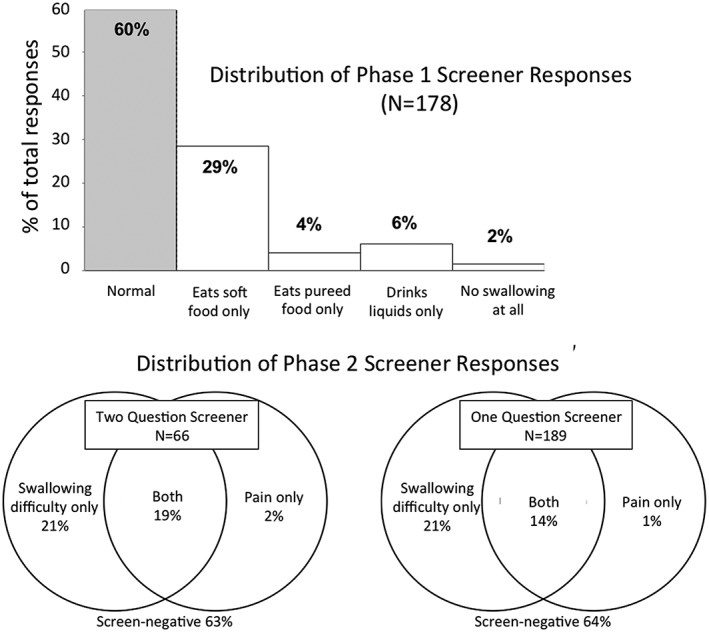
Figure 2.

Prevalence of phases 1 and 2 screener questions. Graphs illustrating screener response distribution for phase 1 and 2, separately. Nearly 40% of all patients in each phase were screen‐positive for dysphagia. For phase 1, screener 1 is reported. For phase 2, the 2‐question screeners used screeners 3 and 4, while the 1‐question screener used screener 5
