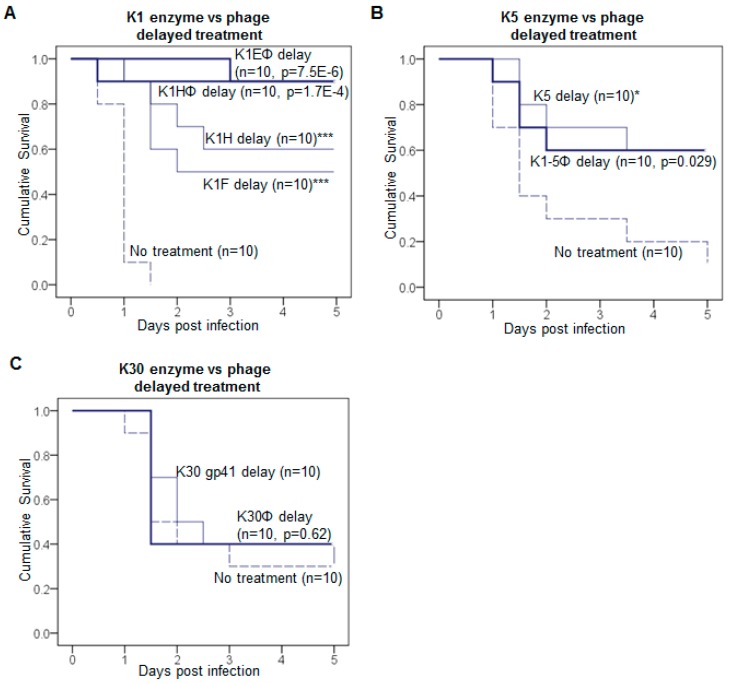
Figure 2.
Comparison of depolymerases and cognate phages in treatment. Delayed treatments using phages were carried out in parallel to depolymerase. (A) K1E and K1H phage; (B) K1-5 phage; (C) K30 phage. Depolymerase data are from Figure 1. For phage treatment, mice were infected with intramuscular (IM) inoculations; 8 h later they received ~107 pfu phage IM in the contralateral thigh. For comparison to depolymerase treatment, this dose of phage carries about 3 × 10⁻⁵ μg of depolymerase (see Methods for calculation). Kaplan-Meier survival curves were plotted as in Figure 1. The mouse number n of each treatment is labeled on each curve. Log rank test: p values for delayed phage treatments compared to the no treatment control are listed, or * p < 0.05, *** p < 0.001 for delayed enzyme treatment as in Figure 1.

