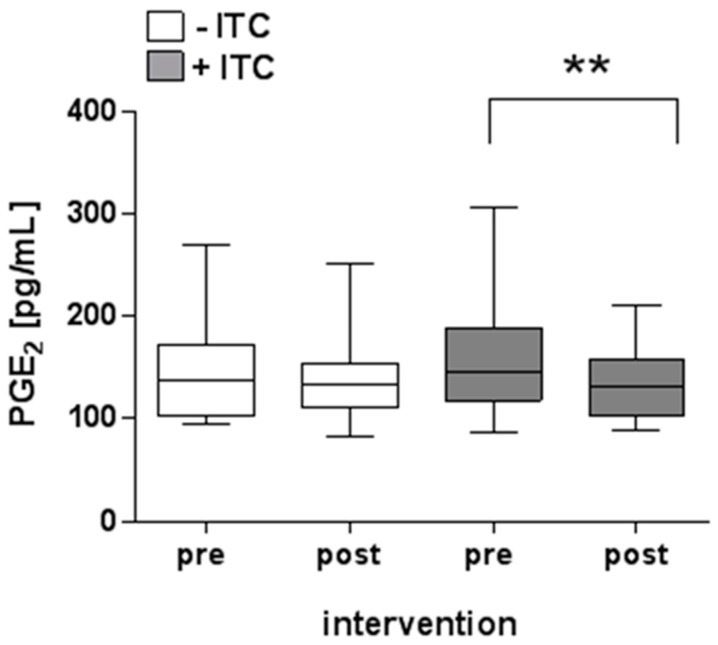
Figure 5.
Effects of B. carinata intervention on prostaglandin E2 (PGE2) plasma levels. White boxes show the PGE2 plasma concentration before (pre) and after (post) intervention with the preparation from cooked B. carinata leaves (−ITC), and grey boxes show the PGE2 plasma concentration before (pre) and after (post) B. carinata intervention with the preparation from raw B. carinata leaves (+ITC) as pg/mL −ITC: n = 18; +ITC: n = 20. Outlier removed. Minimum and maximum values, lower and upper quartiles, and median values are given. Asterisks indicate statistically significant differences (** p ≤ 0.01; Wilcoxon matched-pairs signed rank test).

