
Figure 1.
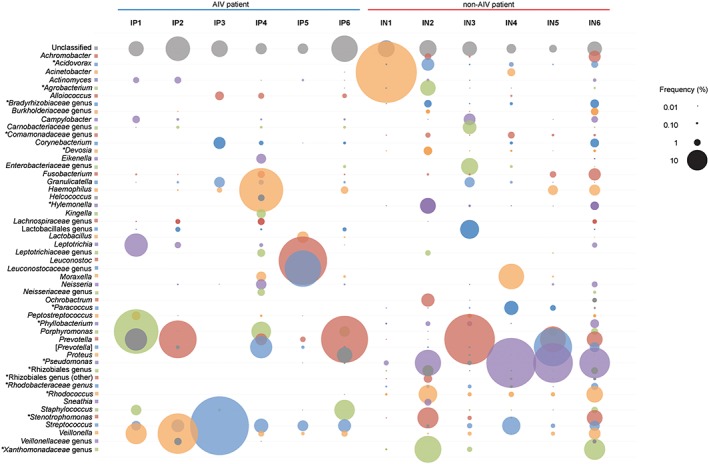
Relative abundance of operational taxonomic units across samples. Circle sizes represent the relative abundance of each operational taxonomic unit present at a frequency above 1%. Genera with frequency differences between groups are marked with an asterisk (*). Abbreviations: IAV, influenza A virus; IN, influenza negative; IP, influenza positive