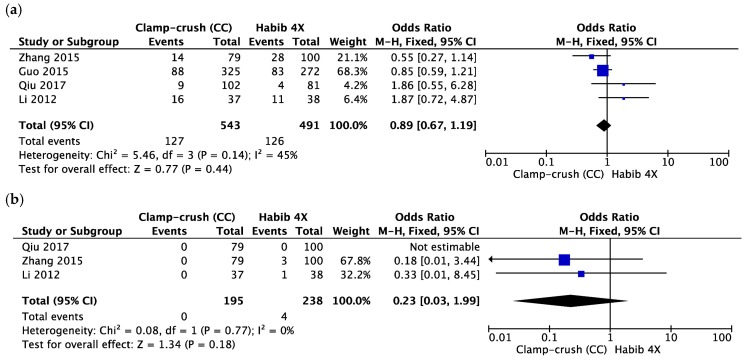
Figure 5.
Forest plot representing (a) total morbidity and (b) 30-day mortality during liver resection comparing the control group (clamp-crush) with the study group (Habib™-4X). Squares’ size depicts effects while comparing the weight of the study in the meta-analysis. The diamond shows no favour towards any study group following analysis. The 95 percent confidence interval is represented as horizontal bars.

