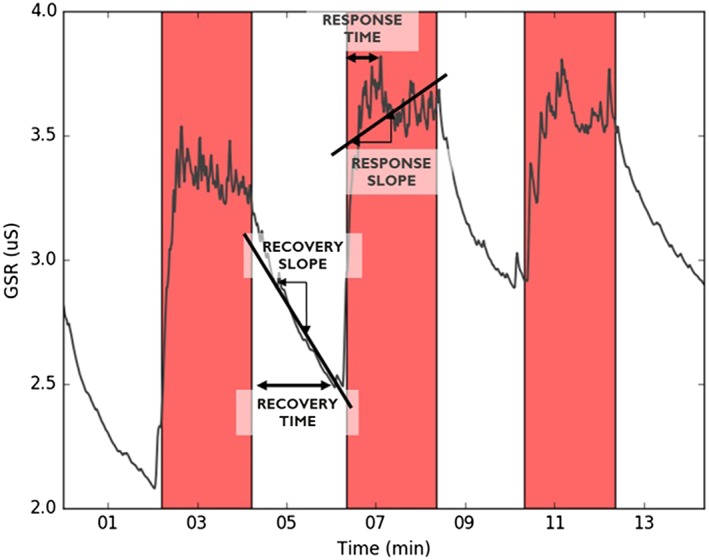
Figure 2.

Dynamic feature calculation including recovery time, recovery slope, response time, and response slope. Red bars represent stress phases; white bars, rest. The example signal is galvanic skin response (GSR) from one participant. The same features are calculated for skin temperature and heart rate
