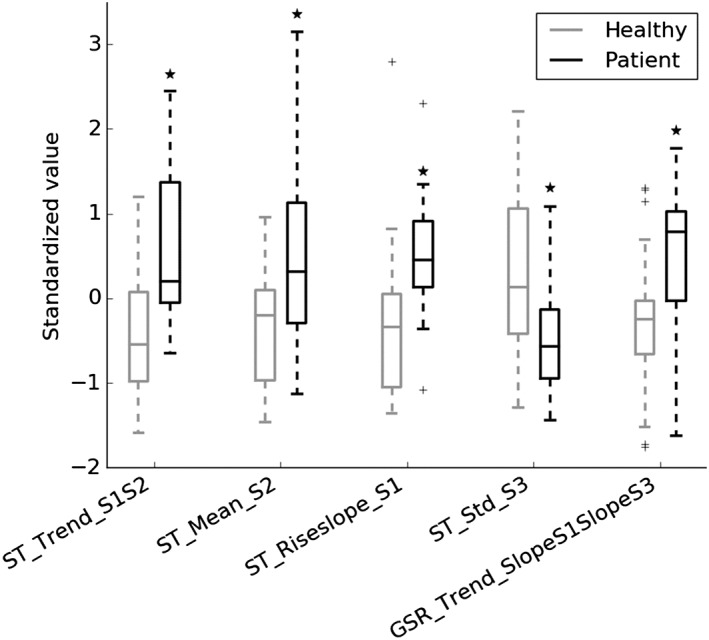
Figure 4.

Boxplots of the 5 most important features of the response feature set for healthy participants and patients. Features are represented as standardized values. The boxplot line represents the median, the box extends from the lower to upper quartile values, whiskers extend from minimum to maximum (indicating the range), and flier points (indicated as +) are considered outliers. *P < .05 vs healthy participants, based on a t test. Feature names contain 3 parts, separated by an underscore: (1) the physiological signal for which the feature was computed, ie, HR, GSR, or ST; (2) the feature (see Table 2); and (3) the stress task(s) for which the feature was computed: S1 = stress task 1 (ie, Stroop Color‐Word test), S2 = stress task 2 (ie, math test), S3 = stress task 3 (ie, stress talk). GSR indicates galvanic skin response; HR, heart rate; ST, skin temperature
