Figure 4.
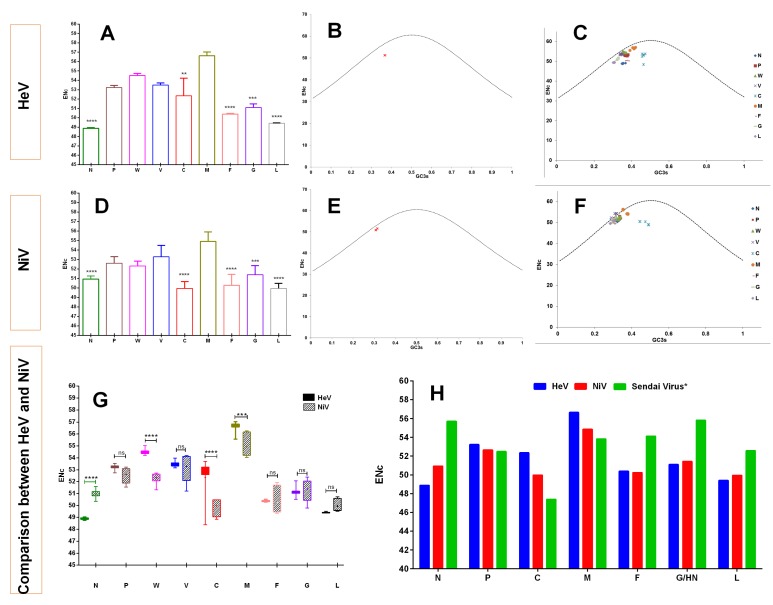
Differential codon bias on the coding sequences of henipaviruses. The gene-wise ENc values for HeV (A) and NiV (D) are presented. The Kruskal-Wallis test was used to see any evidence of significant differences. The ENc–GC3s plots for the complete coding sequences of HeV (B) and NiV (E) are shown. The standard curve (functional relations between expected ENc and GC3s), where the codon usage bias was determined by the GC3s composition only is denoted by a dotted line. Similarly, ENc–GC3s plots for the individual protein-coding sequences of HeV (C) and NiV (F) are also shown. G depicts a comparison of the ENc values among the different proteins encoded by HeV and NiV. The two-way analysis of variance (ANOVA) with Tukey’s honestly significant difference test was used to see any evidence of significant difference. H represents the ENc values comparison of HeV, NiV, and Sendai virus (distantly related). Note: Error bars denote the standard deviation (SD). **** p < 0.0001; *** p < 0.001; ** p < 0.01; ns—non-significant.

