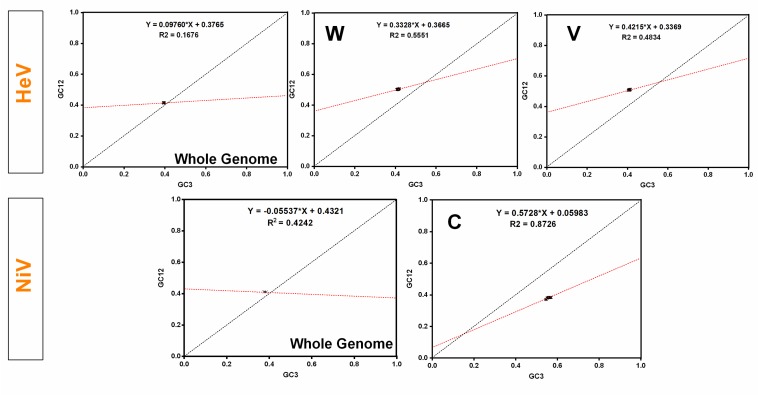
Figure 5.
Neutrality plots for the entire coding sequences of HeV and NiV. In neutrality plots, GC12 of different virus isolates were plotted against GC3. The linear regression of GC12 against GC3 is presented by a red-dotted line (HeV—Y = 0.06900*X + 0.3877, R2 = 0.0339; NiV—Y = −0.05536*X + 0.4321, R2 = 0.424).

