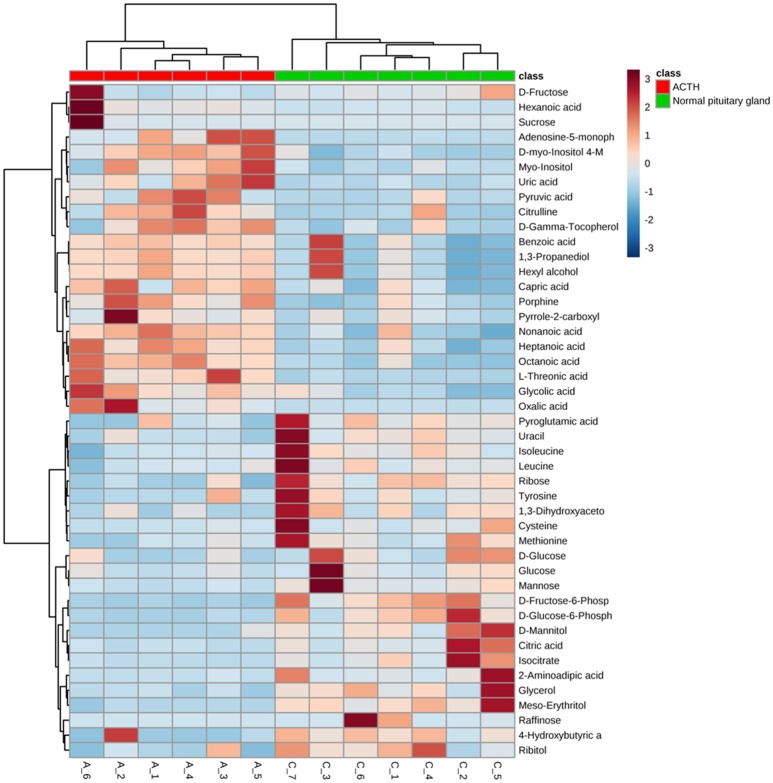
Figure 2.
A heatmap illustrating that the 37 metabolites clearly segregate patients with ACTH-PAs and normal pituitary glands. Each colored cell on the map corresponds to a concentration value in the data table, with samples in rows and features/compounds in columns. The heatmap was used to identify samples/features that are unusually high/low.

