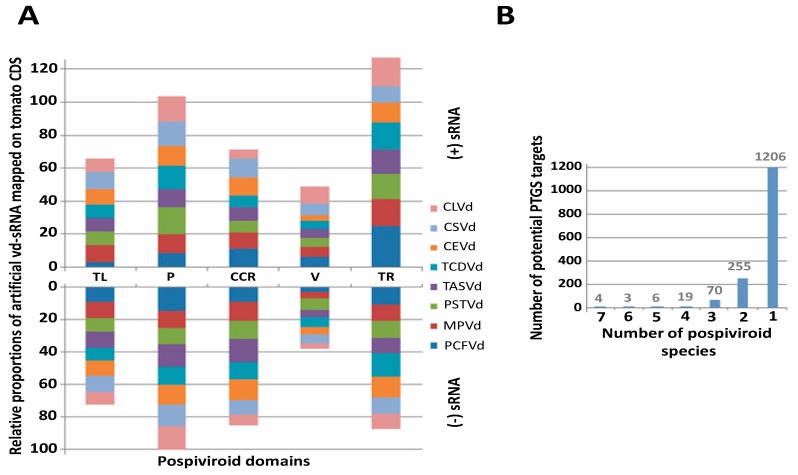
Figure 1.
(A) Distribution among the five pospiviroid domains of the percentage of artificial 21 nt vd-sRNA mapping to tomatoes CDS for each of the eight pospiviroid species able to infect tomatoes (three mismatches/indels allowed). The upper part of the bar graph shows targets of the positive strand of pospiviroids; the lower part shows targets of the negative strand. Statistical differences between domains are represented as binomial regression groups (P < 1e−5 above the upper bar of each domain. The five pospiviroid domains are mentioned according to the following abbreviations: TL—Terminal left; P—Pathogenicity, CCR—Conserved central region; V—Variable; TR—Terminal right. (B) The number of potential PTGS targets shared among pospiviroid species according to the mapping of in silico-generated vd-sRNAs from a set of 891 complete genome sequences of pospiviroids. Here, only the most thermodynamically-stable sites of Table S2a (ΔG ≤ −25 kcal/mol) were reported in this graph.

