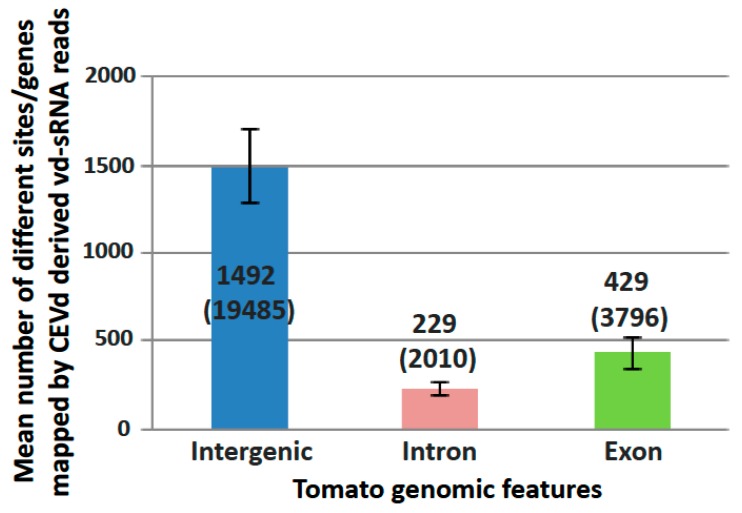
Figure 3.
Mean number of different sites/genes mapped by CEVd derived sRNAs for each of the three tomato genomic features: intergenic region, exon (3′ and 5′-UTR included), and intron. Standard deviations between samples are depicted as error bars. Mean number of reads for each feature are shown in parentheses.

