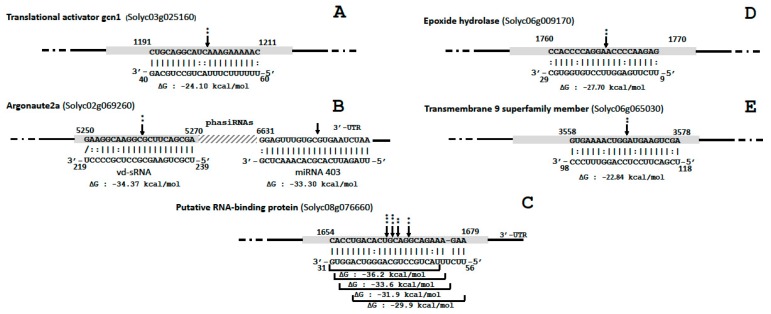
Figure 4.
PTGS targets site of CEVd vd-sRNAs of the five genes highlighted in this study: (A) translational activator gcn1, (B) argonaute 2A, (C) putative RNA-binding protein, (D) epoxide hydrolase and (E) putative RNA-binding protein The arrows indicate the predicted RISC mediated cleavage sites with their respective probability computed according to Poisson’s regression of normalized counts of 5′ RNA ends (* P ≤ 0.05; ** P ≤ 0.01; *** P ≤ 0.001). Complementarity between nucleotide pairs was depicted as follows: | for Watson-Crick base pairs, / for wobble base pairs and: for mismatches. Coding regions of genes are depicted as gray rectangles; intron and 3′-UTR are represented as black lines. The sequences are shown in the complementary polarity. The PairFold online tool was used to predict the minimum free energy (ΔG) of RNA duplexes.

