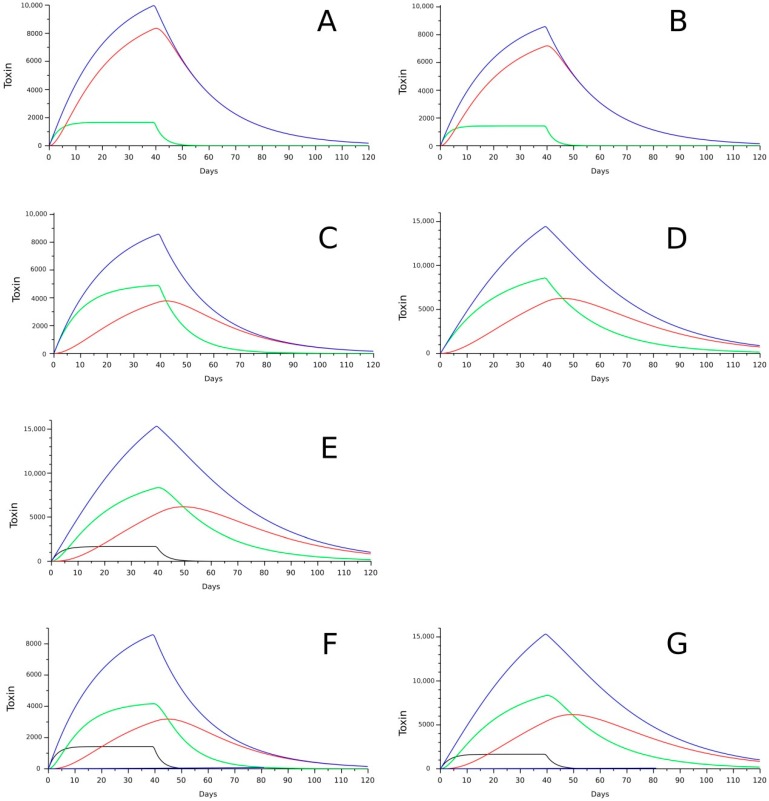
Figure 10.
Models of the kinetics of OA and “DTX3” (A–D), the previous ones plus “DTX5” (E), and PTX2, PTX2sa and its esters (F,G), after 40 days of intoxication (with constant cell abundance in the environment) and 80 days of depuration. The blue line represents total toxin, black is “DTX5” or PTX2, green shows OA or PTX2sa and red, DTX3 or PTX2sa esters. Kinetics with high acylation rate (=0.3 day−1) with only DTX3 depuration (A), and with OA and DTX3 depuration at the same rate (B). Kinetics with low acylation rate (0.05 day-1) with only DTX3 depuration (C), and with OA and DTX3 depuration at the same rate as in A and B (D). Same as C with input of OA and “DTX5” (50%) (E). With depuration of the three forms of PTX2 (F) and with depuration of only PTX2sa esters (G).

