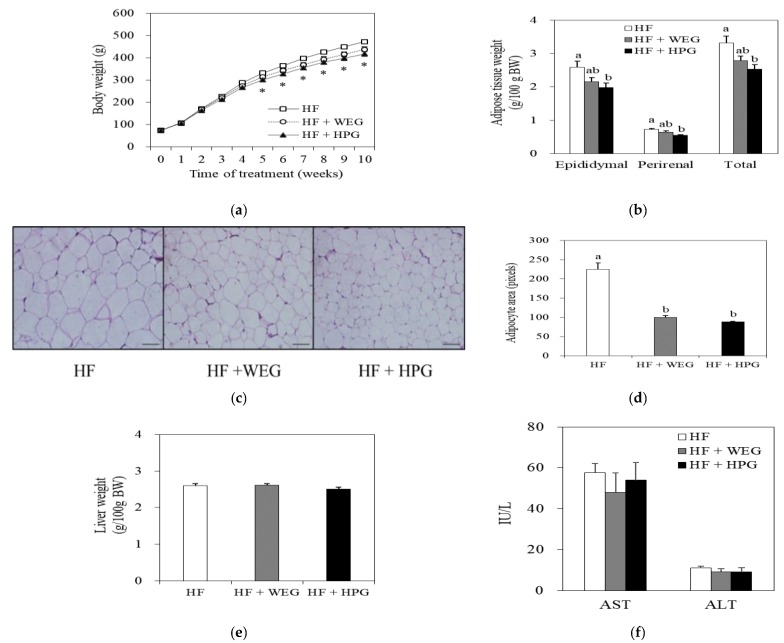
Figure 3.
Effects of WEG and HPG on diet-induced obesity. (a) Body weight and (b) adipose tissue weight of rats fed WEG and HPG diets for 10 weeks; (c) Representative histological sections of epididymal adipose tissue; hematoxylin and eosin stain, scale bar = 100 μm; (d) Average adipocyte size was presented as pixels; (e) Liver weight and (f) serum aspartate transaminase (AST) and alanine transaminase (ALT) levels. Values are expressed as mean ± SEM (n = 9/group). * p < 0.05 compared to the HF group. a,b Mean values with unlike superscript letters are statistically different at p < 0.05. HF: high fat; WEG: hot water extract of ginger; HPG: high-hydrostatic pressure extract of ginger.

