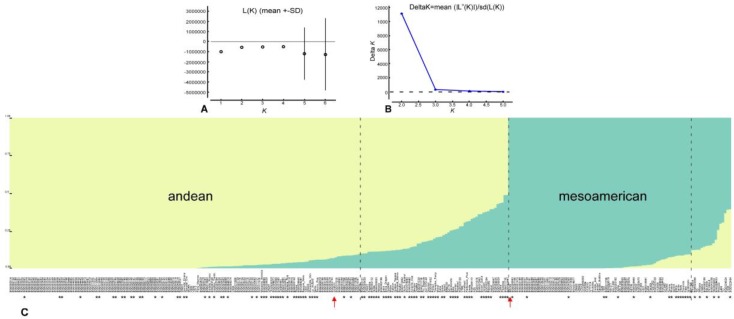
Figure 3.
(A) Mean L(K) (±SD) over 20 runs for each K value. (B) Plot of ∆K. (C) Plot of ancestry estimated for K = 2. Bars represent the estimated membership coefficients for each accession in each population (represented by different colors) using a threshold value of 0.9 for the Q statistic. Arrows indicate the Andean cultivar G19833 and the Mesoamerican BAT93. Asterisks indicate lines that can be used for snap consumption.

