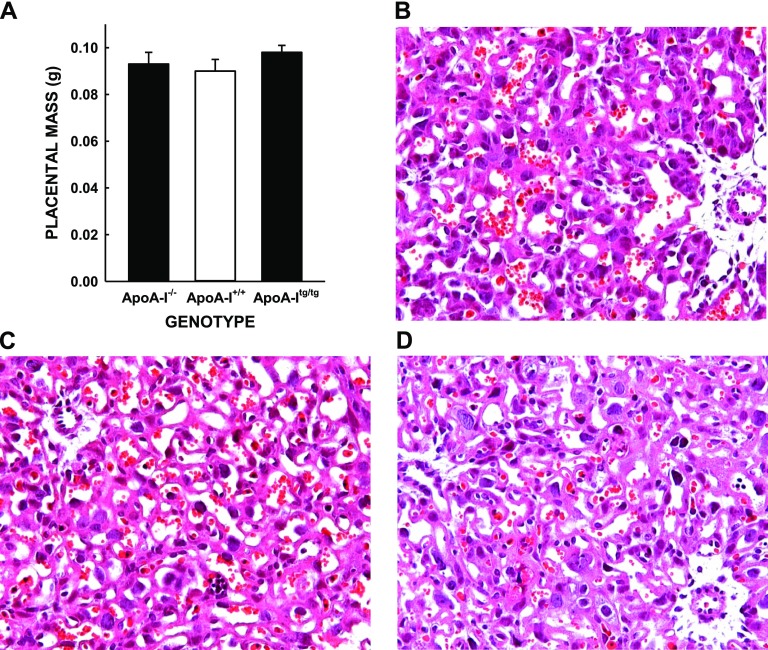
Figure 3.
Placental masses, histology, and cholesterol concentrations of apoA-I−/−, apoA-I+/+, and apoA-Itg/tg pregnant mice. A) Placentas were collected from a subset of mice and weighed (n = 9–10). Data are presented as means ± sem. Histology (hematoxylin and eosin) of representative placentas from a total of 11 placentas apoA-I−/−(B), apoA-I+/+(C), and apoA-Itg/tg (D) pregnant mice are shown.

