Figure 2.
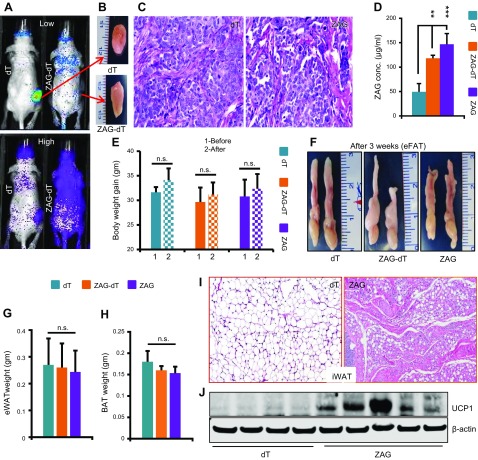
ZAG induces brown-like phenotype in iWAT. A) Representative multispectral optical images showing the dT control and ZAG-dT–expressing HEK-293 cell implantation site (red arrows). dT positivity was observed throughout the body of ZAG-dT cell–implanted mice due to circulating ZAG-dT in these mice. B) Representative pictures showing a small tissue mass that was formed by the HEK-293 cells 6 wk after implantation. C) Representative H&E-stained sections of dT- and ZAG-expressing HEK-293 cell implants harvested from nude mice 6 wk after implantation. D) Serum levels of ZAG in athymic nude mice 3 wk after subcutaneous implantation of dT, ZAG-dT, and ZAG HEK-293 cells. Data are presented as means ± sd; n = 5. **P < 0.005, ***P < 0.0005. E) Body weight of dT, ZAG-dT, and ZAG cell–implanted mice before and 3 wk after implantation. Data are presented as means ± sd; n = 5. F) Representative pictures of eWAT pads in athymic nude mice 3 wk after implantation of dT, ZAG-dT, and ZAG HEK-293 cells. G, H) Average weight of eWAT pads (G) and BAT (H) in mice 3 wk after implantation of dT-, ZAG-dT– or ZAG-expressing HEK-293 cells. Data are presented as means ± sd; n = 5. I) Representative H&E-stained iWAT of athymic nude mice 3 wk after implantation of dT- or ZAG-expressing HEK-293 cells. J) Expression level of Ucp1 in the iWAT of dT- or ZAG-expressing cell–implanted mice. N.s., not significant.

