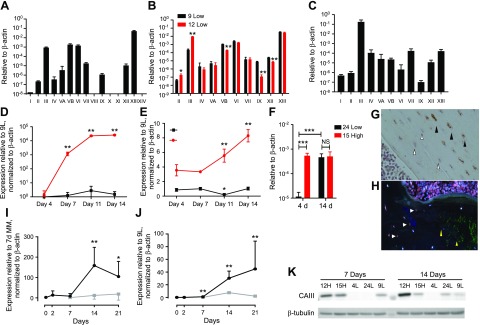
Figure 3.
CA expression and regulation. Cells were plated at 10 × 105 cells/ml and cultured at a permissive temperature (33°C) for 3–4 d before being moved to a nonpermissive temperature (37°C). A) Semiquantitative PCR for all CA isoforms. CAIII, CAVB, CAVI, and CAXIII were highly expressed in Ocy454 cells. Data are normalized to β-actin. B) CA isoform expression in 12H (high) and 9L (low) Sost cells. CAII and CAIII were significantly increased in 12H, whereas CAVB, CAIX, CAXII, and CAXIII were significantly reduced. C) CA expression in mouse femurs (n = 5). Among the isoforms, CAIII is the most abundant in bone. D, E) Time course expression of Sost (D) and CAIII (E) in Ocy454-12H (red line) and Ocy454-9L (black line). F) CAIII expression in 24L (black bars) and 15H (red bars) after 7 and 14 d in culture. G) Immunohistochemistry analysis of mouse femur. CAIII-positive osteocytes (black arrowheads) are more abundant in the center of the cortex, whereas CAIII-negative cells (open arrowheads) are closer to the endosteal surface. Original magnification, ×40. H) Immunofluorescence for CAIII (red, white arrow) and sclerostin (green, yellow arrows) in human iliac bone. I, J) Expression of Sost (I) and CAIII (J) in primary osteoblasts that were isolated from mouse calvaria were cultured up to 3 wk in the absence (gray line) or presence of 50 μg/ml ascorbic acid and 10 mM β-glycerophospate (mineralization medium, black line). Data are expressed as means ± sd. One-way ANOVA with Tukey’s multiple comparison test was performed. K) Western blot analysis of whole-cell lysate after 7 and 14 d. CAIII is highly expressed in 12H and 15H clones already at 7 d. NS, not significant. *P < 0.05, **P < 0.01 (vs. d 0 mineralization medium); ***P < 0.001, ΨP < 0.01 (vs. d 7 growth medium only). All experiments were performed in triplicate.

