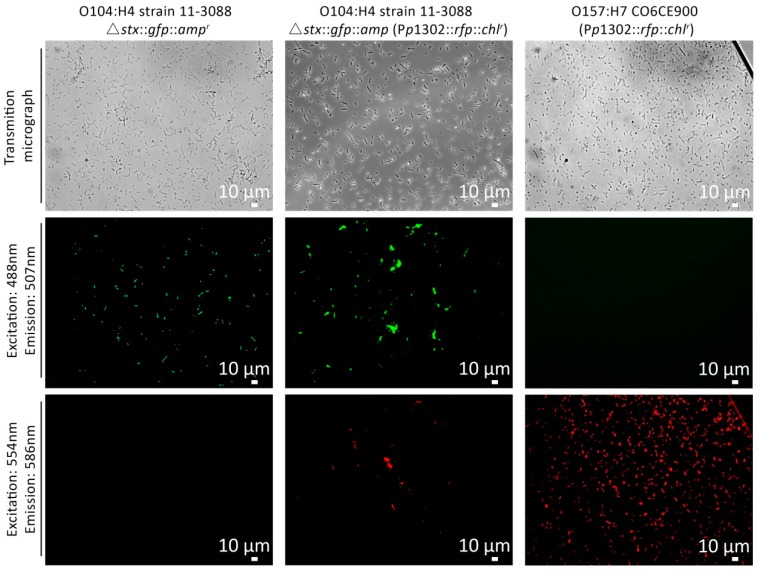
Figure 5.
Microscopic observation of strains of E. coli expressing GFP or DsRed under control of Shiga-toxin promotors after MMC induction. Cells were visualized at 400× magnification by light microscopy or fluorescence microscopy as indicated. Shown from left to right are E. coli O104:H4 11-3088 Δstx::gfp::ampr (negative control for DsRed expression); E. coli O104:H4 11-3088 Δstx::gfp::ampr (Pp1302::rfp::chlr), and E. coli O157:H7 CO6CE900 (Pp1302::rfp::chlr) (negative control for GFP expression). MMC induction was performed 4.5 h before microscopy observation.

