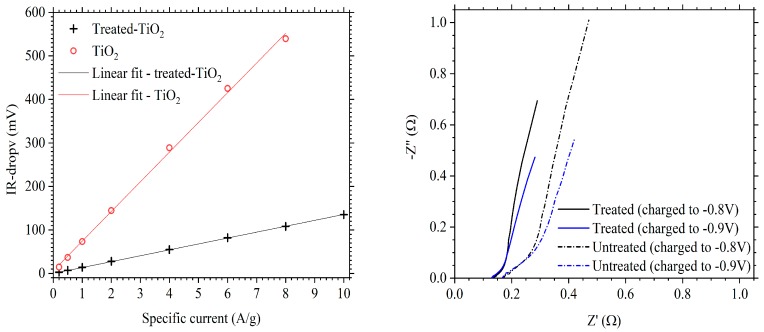
Figure 7.
(a) Comparison of IR-drop, between charge and discharge, for treated-TiO2 (black cross) and TiO2 (red circle) as a function of specific current; (b) Nyquist plot of a TiO2 (dash-dot line) and treated-TiO2 (solid line) electrode. Measurements were taken between 0.1 Hz–10 kHz, at open circuit potential (OCP), after charging to −0.8 V (black) and −0.9 V (blue) vs. SCE.

