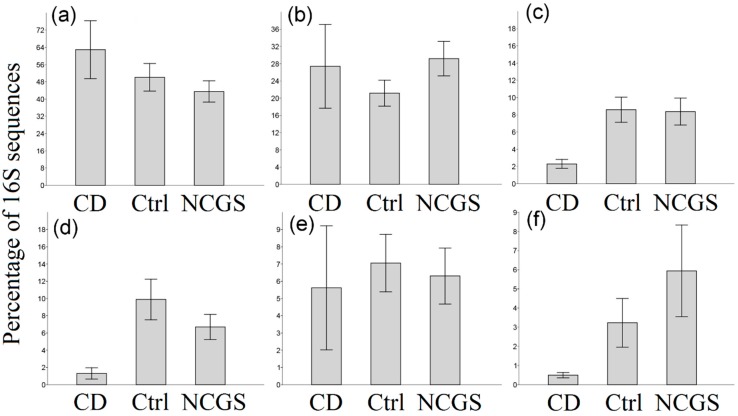
Figure 2.
Bar charts showing the relative proportions of the 16S rDNA reads from the duodenal microbiota for all the main phyla. (a) Proteobacteria, (b) Firmicutes, (c) Bacteroidetes, (d) Fusobacteria, (e) Actinobacteria, (f) Others. Significant differences were only found in Bacteroidetes (c) and Fusobacteria (d), see main text. Bars represent the mean ± SE.

