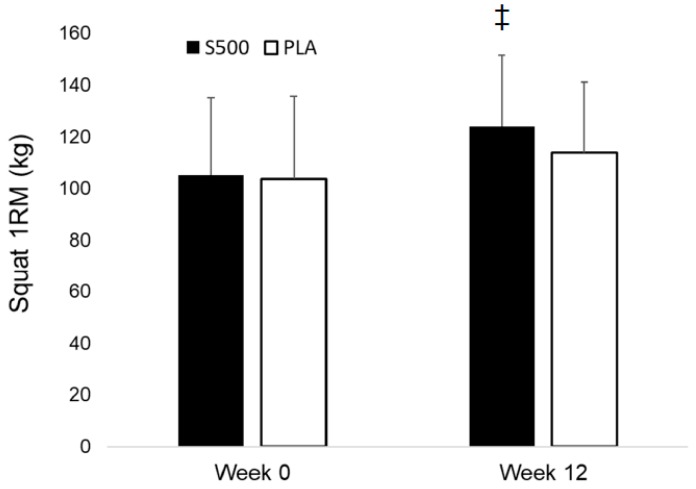
Figure 2.
Squat 1 RM in kilograms for S500 and PLA at week 0 and week 12. Solid bars depict S500 data, while white bars depict PLA data. Data is represented as means ± SD. No difference was found between groups at week 0, and is represented as ‡. A significant group × time interaction (p = 0.009) with post hoc tests indicating S500 increased squat 1 RM to a greater extent than PLA.

