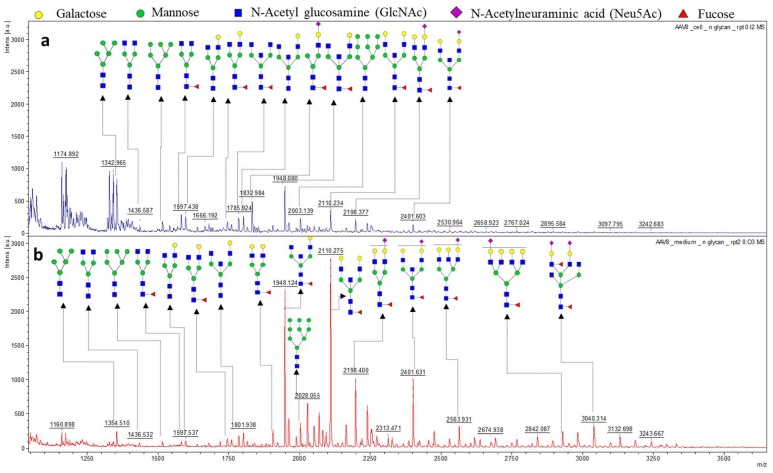
Figure 3.
MALDI- MS spectra of 2-AA derived N-glycan in negative mode [M−H]−. (a) The whole glycome profile of intracellular AAV8. (b) The whole glycome analysis of secreted AAV8. The most intense peaks from both the spectra (m/z 2110.234, 1948.088, 2401.633, 1832.984 were further confirmed by MS/MS fragmentation spectra in MALDI-TOF MS in lift mode (supplemental Figure S2).

