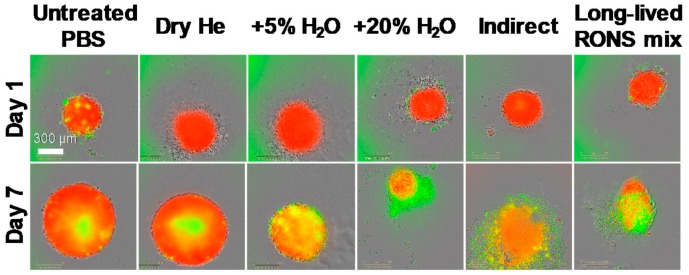
Figure 2.
Spheroid growth/shrinkage upon the different treatments applied. Representative images of spheroid growth/shrinkage and cytotoxic effect in U87-Red spheroids on day 1 and 7 days after exposure to the different treatments tested. Living cells in red, Cytotox Green+ cells in green. Scale bar = 300 µm.

